4.11 - Cluster Monitoring
Objectives
Describe Prometheus
Describe Grafana
Monitoring
TKG provides cluster monitoring services via the two projects:
Prometheus:
A systems monitoring and alerting toolkit
Collects metrics from clusters and applications at specific intervals
Triggers alerts depending on conditions
Grafana:
Visualization and analytics software
Allows query, visualization, and alerting operations for metrics; as well as alerting
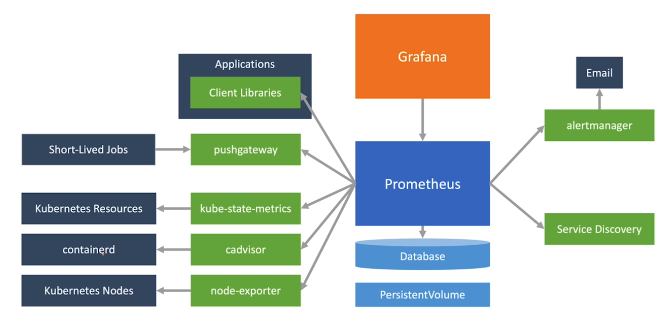
Architecture
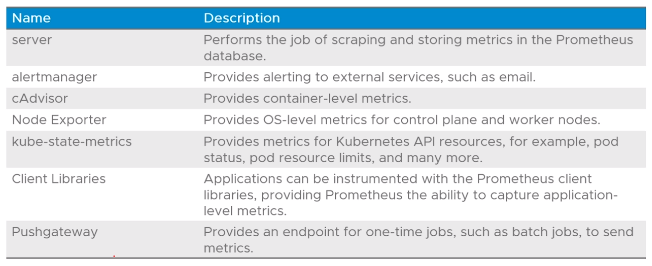
Prometheus Components
Standard Prometheus deployment comes with the following components:
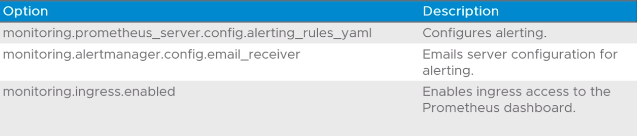
Prometheus Configuration Options
Default prometheus configuration values are generally fine, but for particular use cases the prometheus-data-values.yaml file can be edited with options such as:
Grafana
An open-source monitoring and observability platform
Can connect to and pull data from many sources
Provides dynamic dashboards, graphs and visualization for Prometheus backend data.
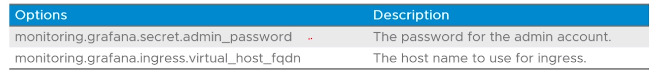
Grafana Configuration Options
Similar to Grafana configuration, the grafana-data-values.yaml file must be edited with parameters, including the following, to work: